Salkku economic indicators have been redesigned. Previously only two economic indicators were used, namely PMI and government bond yield spreads. Now two types of indicators are analysed here, coincident and leading indicators. Our own leading indicator models are also being built, which uses a collection of indicators to train custom machine learning models.
Coincident and leading indicators
Coincident indicator is an indicator which tells us how the economy is doing right now. For that, Composite PMI readings are still useful when trying to understand the current state of the economic environment.
Our first leading indicator is a custom machine learning model for US markets, which includes not only yield spread, but also time series data like VIX options data and comparing individual market sectors performance vs. aggregate market index. Near term historical performance of individual S&P500 sector indexes, like like technology, industrials, basic materials etc., are compared to aggregate S&P500 index performance. According to analysis, this kind of data has predictive power in large enough timeframe when it comes to performance of the aggregate index.
Our first machine learning model is built to identify leading indicator levels, which precede aggregate market index being lower or higher in the future. This kind of model is able to point best and worst times to invest. The timeframe for our analysis is one year forward.
Coincident economic indicators
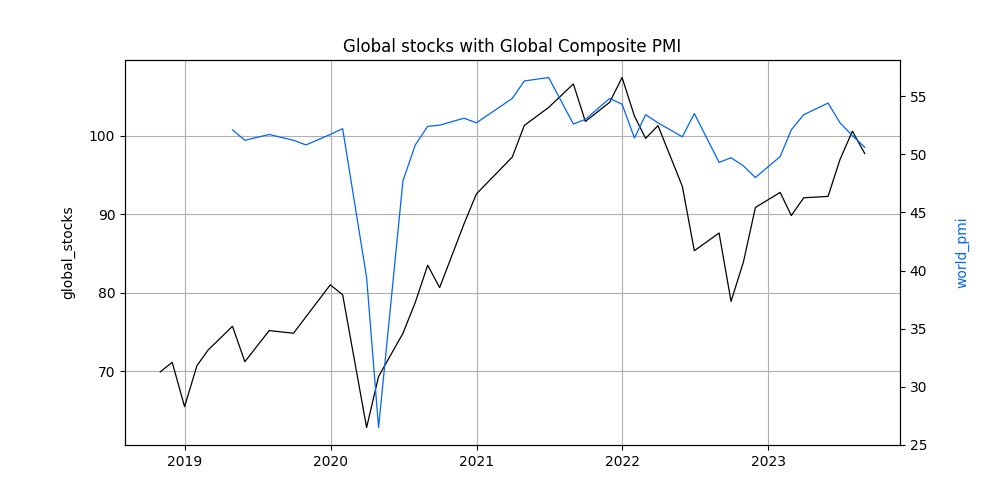
Currently Global Composite PMI is barely above 50, indicating economic activity is not expanding or contracting. United States is at 50.2, China at 50.9 and eurozone in recessionary readings at 47.2.
Leading economic indicators
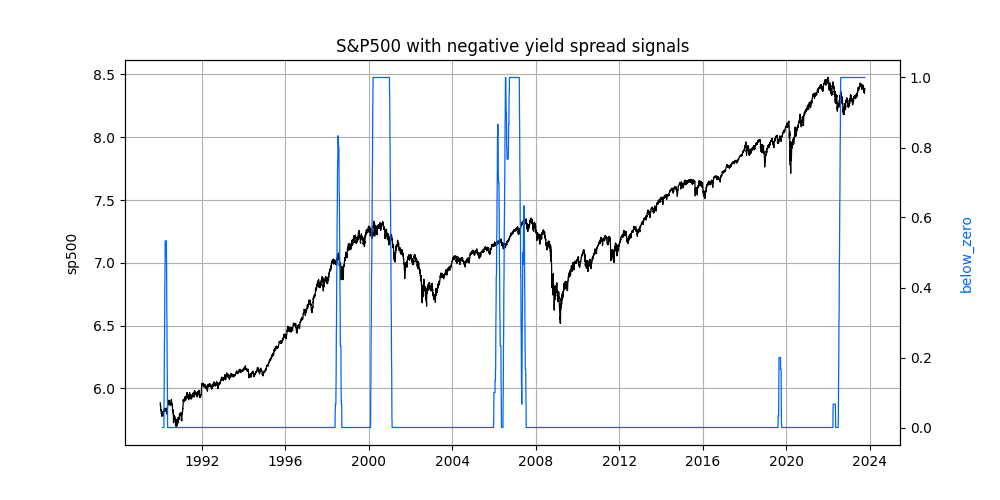
Figure 2. shows previous times in the last three decades where United States government 10 minus 2 year yield spread has been below zero. Most negative outcomes are associated with yield spread being below zero for an extended time.
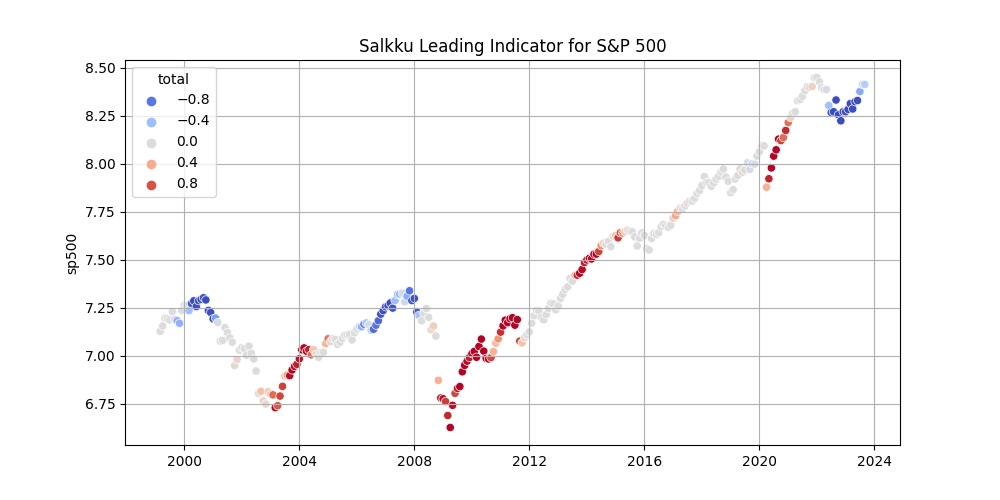
Figure 3. shows our new machine learning model for US markets built from collection of leading indicators. Currently the model identifies conditions being roughly similar as in 2000 and 2007 market tops. According to our model, leading indicators are presently at levels which have preceded major stock market declines in the past.
Thoughts on 2023Q4
According to our US leading indicator, market conditions do not look good. Yield spread is still negative in US and in other developed economies. That usually has meant market cycle being about to turn to contraction in one year timeframe. We therefore expect S&P 500 performance to be negative in one year time horizon. Because US is the biggest economy by far, this also has a significant sway to other developed regions as well, namely Europe and Japan.
Interestingly market analysts are still predicting earning per share for S&P 500 to grow in 2024 compared to this year. Stock prices usually rise and fall in anticipation of future earnings, so growing earnings would also raise broad stock market indexes. EPS predictions are not very good leading indicators though. For example in 2008 consensus forecast did not start to degrade until right before Lehman collapse in September.